
Each Member State must prepare a Pressure and Impact Analysis every six years. This report describes man’s pressure on the water system and the impact we have on the ecosystem. This analysis is crucial in preparing the programme of measures to restore ecological water quality in all water bodies. In Belgium, each region (Flanders, Brussels and Wallonia) conducts these Pressure and Impact Analyses. They all use the WEISS (Water Emission Inventory Support System) tool for this purpose. However, because of different approaches (source-process-oriented view), load estimates, problem pollutants (context), etc. in the different regions, several insights are possible. That’s why it could be valuable to look at this in a cross-regional way. We could, for example, learn more about the pressures and impacts on our water system as a whole and may be able to detect, and take, any necessary action as needed. This exercise was created for the Senne, a river that crosses the three regions, and poses its specific challenges in each region.
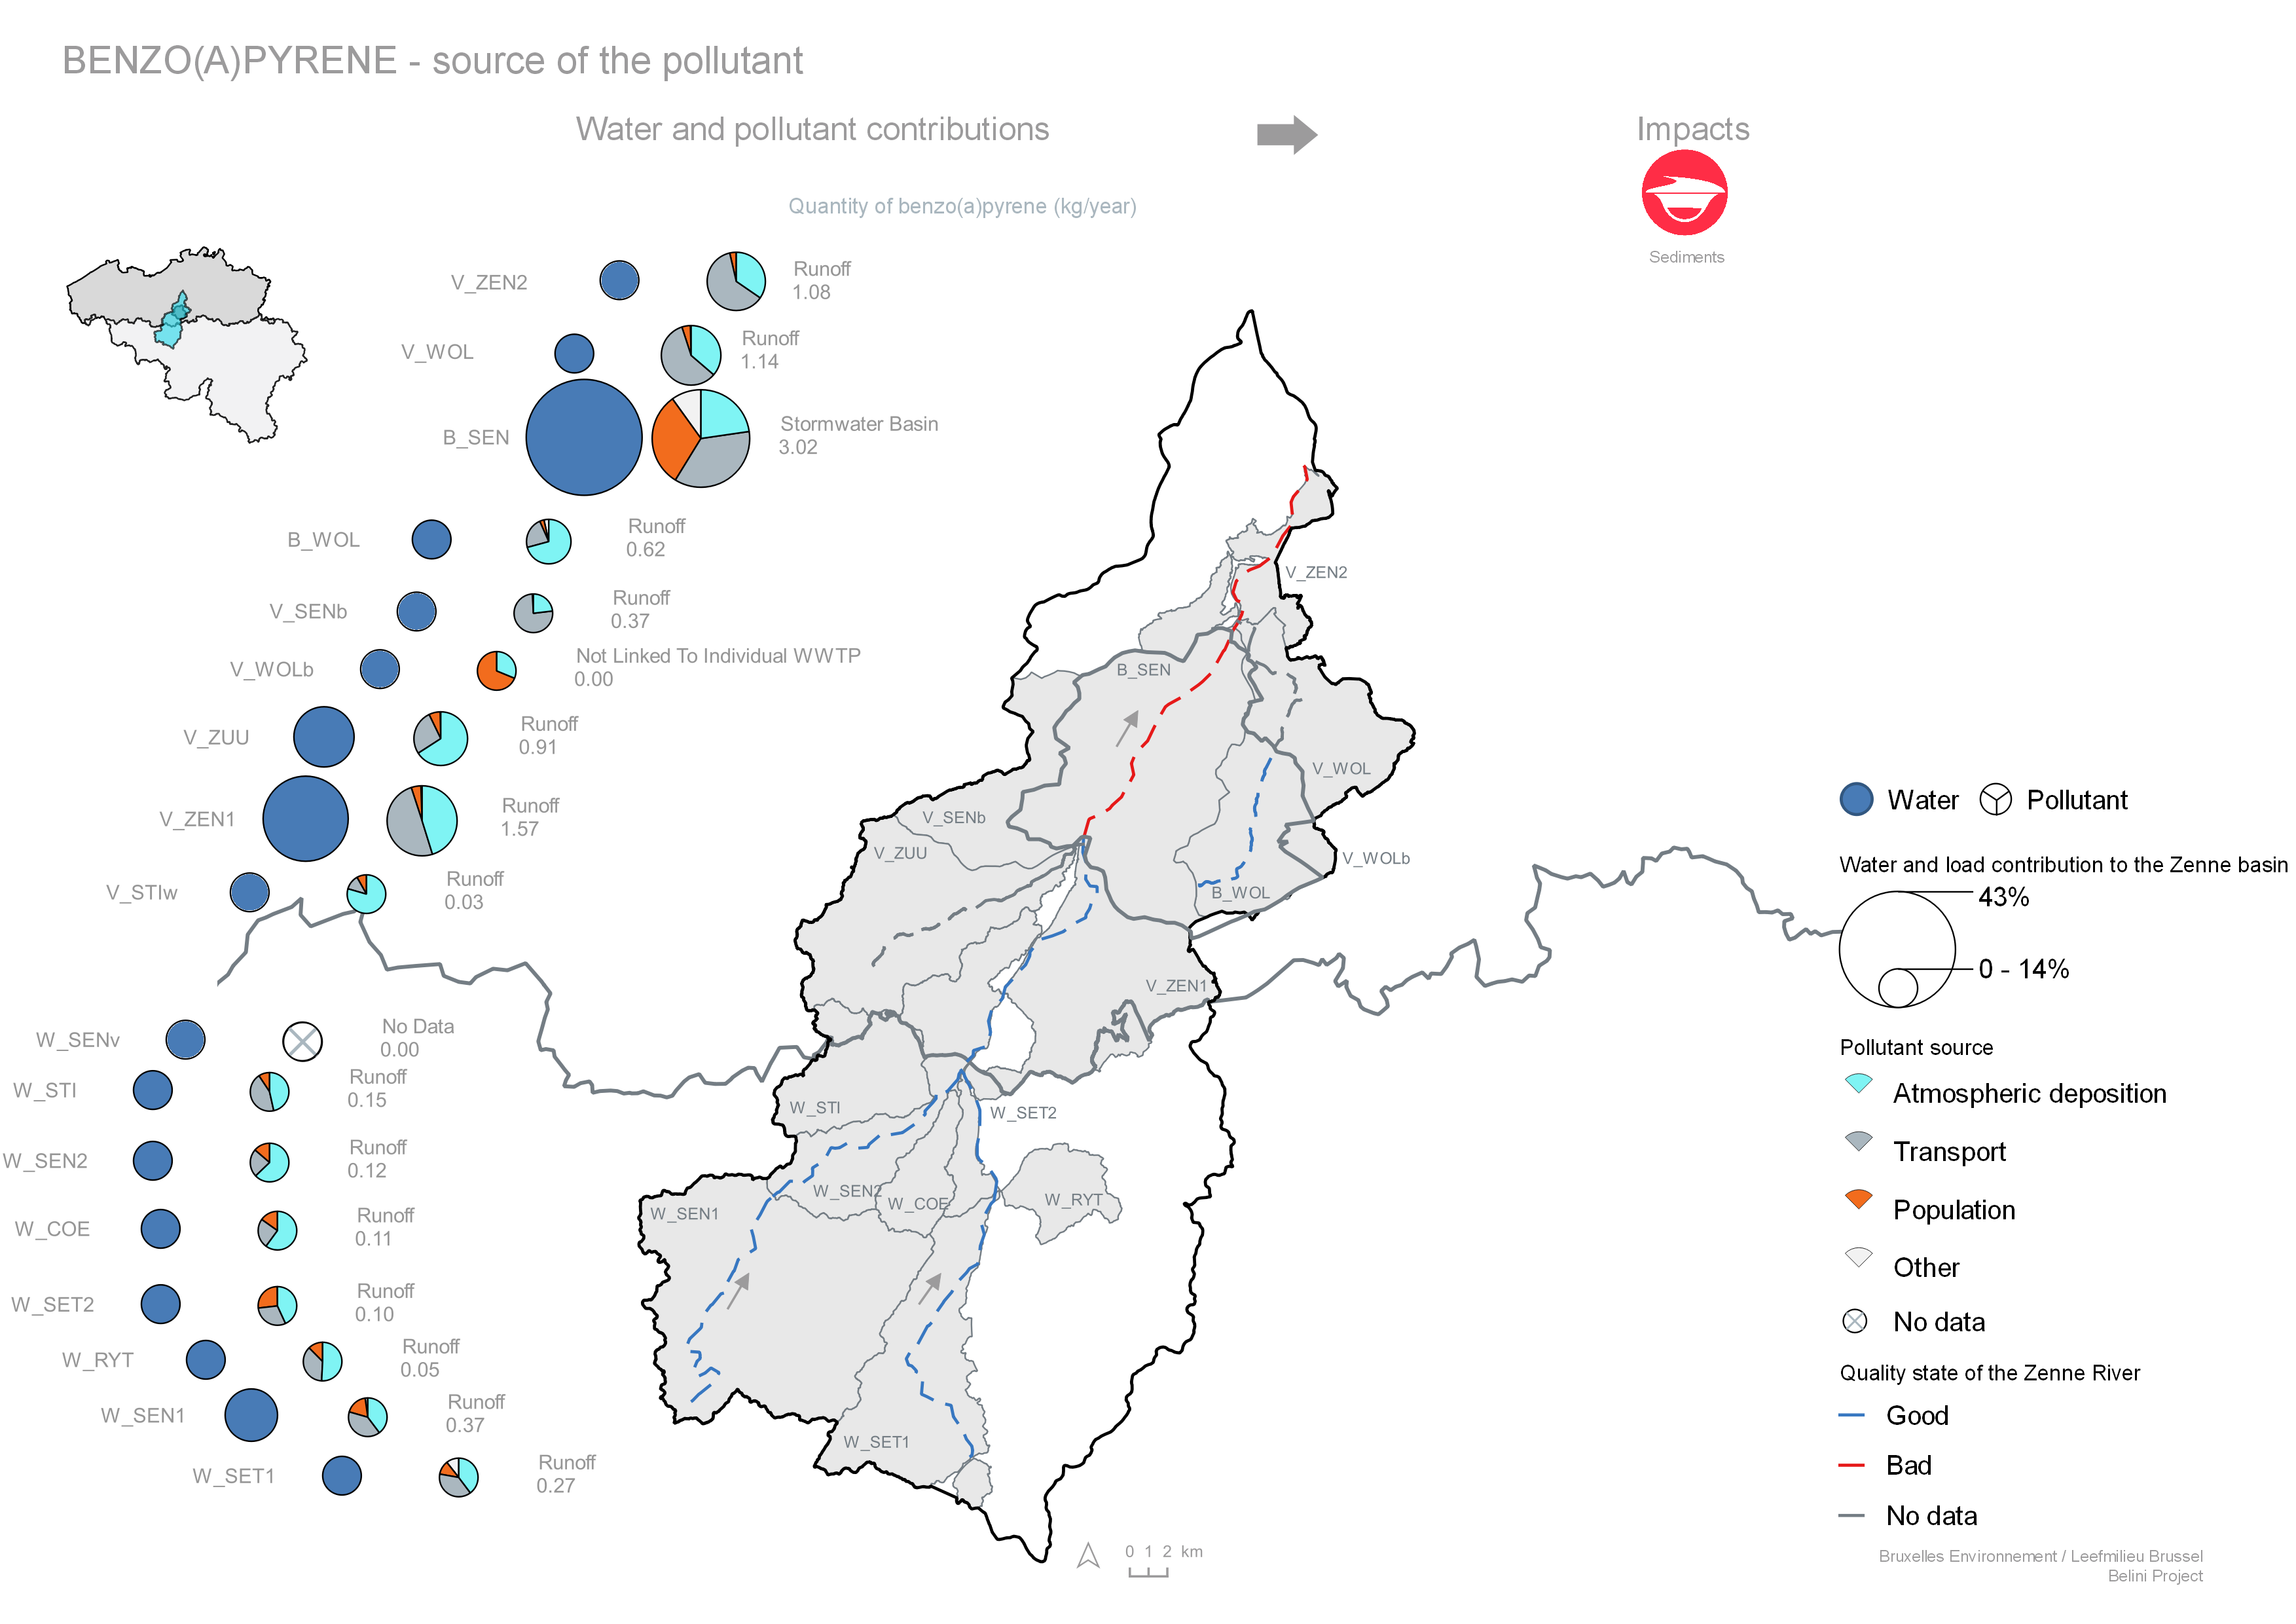
For this exercise, the Pressure and Impact Analysis was presented for the three regions in a similar visual manner, and this for pollutants perceived as problematic in the three regions: mercury, B(a)P), Flu, Ntotal, Ptotal and COD, this for the years 2015-2017. It was also decided to visualise only the pressures (due to human activities, i.e. transport, population, etc.) that exceeded 10%. In doing so, both the load and cumulative flows were represented. The path of pollution has also been depicted. To also visualise and analyse the impact on the water system geographically, the figures have been added to a watercourse map. We have included an example for Benzo(a)Pyrene, B(a)P (Fig.).
It is evident that this pollution is mainly related to atmospheric deposition, transportation and population. Most (cargo-related) pollution occurs in the Senne in Brussels and in Flanders upstream of Brussels, then downstream of Brussels in Flanders. This can probably be linked to extensive urbanisation. Along with accumulation in sediment and biota, we can observe a general deterioration in status going from upstream to downstream.
You can read the entire analysis for all pollutants in the technical report in English by request (l.geerts@vmm.be).